


1. Market insights
- Brazilian outbound travel reached 12.8 million international trips in 2024, representing a 18.5% increase from 2023
- Average travel expenditure per international trip reached R$15,200 (US$2,850), a 22% increase since 2022
- Luxury segment travel spending grew by 35%, with premium travelers spending an average of R$28,500 (US$5,350) per international journey
- 72% of Brazilian travelers expressed intentions to increase their travel budget for 2025
- Long-haul travel from Brazil increased by 26% year-over-year, indicating growing interest in distant destinations
- Business travel recovered to 94% of pre-pandemic levels, with significant growth in the MICE sector
- 62% of Brazilian luxury travelers now request personalized experiences versus standardized packages
- International cruise bookings by Brazilians increased 42% year-over-year
- Multi-generational family travel grew by a substantial's 38% compared to 2023
- Average trip duration increased to 12.8 days (up from 10.5 days in 2023)
Travel Media Landscape
- 85% internet penetration with average daily digital media consumption of 5.4 hours
- 97% smartphone ownership among middle and upper-class Brazilians with 82% researching travel on mobile devices
- 88% social media penetration with 3.6 hours average daily usage (highest in Latin America)
- 78% of travel bookings completed through digital channels (up from 65% in 2023)
- Print travel media reaches 38% of Brazilian travelers monthly
- Travel OOH advertising exposure averages 48 minutes per day for urban professionals
- Travel content consumption on streaming platforms increased by 52% since 2023
- 92% of Brazilian travelers use multiple channels during their travel purchase journey
- WhatsApp used by 98% of travelers for trip planning with family and friends
- Instagram influence on travel decisions increased 45% year-over-year
- Audio travel content (podcasts, streaming radio) consumption increased by 58% in 2024
Key Advantages for Travel Advertisers
- Brazil is the largest outbound travel market in Latin America
- Strong post-pandemic recovery with travel spending now 112% of 2019 levels
- Direct air connections to 65+ international destinations
- 70% passport ownership among middle and upper classes (15% higher than 2022)
- Generous vacation entitlement culture (30 days annual leave is standard)
- Weak domestic currency (Real) making international marketing more cost-effective
- Cultural affinity for travel as status symbol and life experience
- Growing digital nomad community with remote work culture expansion
- High social media sharing of travel experiences driving influence
- Strong aspirational culture around international travel experiences
Positive Market Trends
- Expansion of visa waiver programs with 12 new countries for Brazilian citizens in 2024
- New direct flight routes from Brazilian airports (18 new international routes added in 2024)
- Average annual leave usage of 92% (significantly higher than global average)
- Growing long-stay travel trend with 28% increase in trips lasting 14+ days
- Increasing preference for premium travel with business/premium economy air bookings up 32%
- Strong economic recovery in key source regions (São Paulo, Rio de Janeiro, South)
- Rising middle class with international travel aspirations
- Increase in travel-specific credit cards and loyalty programs (45% growth in travel card issuance)
- Growing sustainable travel consciousness (48% of Brazilian travelers consider sustainability factors)
- Multi-destination trips increased by 35% year-over-year
2. Exactly where to advertise
Premium OOH Advertising Locations
Airport Corridors and Transit Hubs
- São Paulo Guarulhos International Airport
- Traffic: 22.8 million annual departing passengers
- Demographics: 52% leisure travelers, 48% business travelers
- Performance: 82% recall rate for premium wall displays
- Cost efficiency: R$42-65 CPM
- Premium placement: Terminal 3 international departure corridor and premium security approach
- Rio de Janeiro Galeão International Airport
- Traffic: 8.6 million annual departing passengers
- Demographics: 58% leisure travelers, 42% business travelers
- Performance: 76% recall for terminal digital networks
- Cost efficiency: R$35-48 CPM
- Premium placement: International departures hall and airline lounges
- São Paulo Congonhas Airport (Domestic Hub with International Connections)
- Traffic: 18.2 million annual passengers
- Demographics: 65% business travelers, 55% frequent international travelers
- Performance: 72% recall for digital displays
- Cost efficiency: R$32-45 CPM
- Premium placement: Main terminal concourse and VIP service areas
- Brasília International Airport
- Traffic: 10.5 million annual passengers
- Demographics: 58% government/business travelers, 46% international travelers
- Performance: 68% recall for terminal advertising
- Cost efficiency: R$28-40 CPM
- Premium placement: International departures and government VIP areas
Business Districts with High Travel Decision-Makers
- São Paulo - Faria Lima/Itaim Financial District
- Traffic: 225,000 daily professionals
- Demographics: 72% senior management, 68% with international travel frequency
- Performance: 65% higher engagement compared to general OOH
- Cost efficiency: R$38-58 CPM
- Premium placement: Faria Lima tower lobbies and JK Iguatemi business approach
- Rio de Janeiro - Centro Business District
- Traffic: 165,000 daily professionals
- Demographics: 65% corporate decision-makers, 58% frequent international travelers
- Performance: 62% higher travel ad recall
- Cost efficiency: R$32-48 CPM
- Premium placement: Rio Branco Avenue digital network and corporate tower entrances
- São Paulo - Avenida Paulista Corporate Corridor
- Traffic: 185,000 daily professionals
- Demographics: 68% mid-to-senior management, 62% with travel budget authority
- Performance: 58% higher engagement with premium travel content
- Cost efficiency: R$35-52 CPM
- Premium placement: MASP museum adjacency and corporate tower entrances
Affluent Neighborhoods with Strong Travel Propensity
- São Paulo - Jardins/Higienópolis
- Traffic: 95,000 daily affluent residents and visitors
- Demographics: 82% high-income households, 75% frequent international travelers
- Performance: 4.2x higher engagement with luxury travel content
- Cost efficiency: R$42-68 CPM
- Premium placement: Oscar Freire luxury retail corridor and Rua Haddock Lobo displays
- Rio de Janeiro - Leblon/Ipanema
- Traffic: 85,000 daily affluent residents and visitors
- Demographics: 85% high-income households, 78% luxury travel preference
- Performance: 4.5x higher conversion for premium travel offerings
- Cost efficiency: R$45-72 CPM
- Premium placement: Leblon shopping approach and Ipanema beachfront displays
- Brasília - Lago Sul/Lago Norte
- Traffic: 55,000 daily residents
- Demographics: 78% government officials/diplomats, 72% international travelers
- Performance: 3.8x higher luxury travel ad engagement
- Cost efficiency: R$38-58 CPM
- Premium placement: Ponte JK approach and diplomatic quarter displays
Travel-Adjacent Locations
- CVC Travel Premium Stores Network (National)
- Traffic: Combined 380,000 weekly visitors
- Demographics: 68% active travel planners, 55% middle-upper income
- Performance: 4.8x higher immediate travel inquiries
- Cost efficiency: R$28-42 CPM
- Premium placement: Store entrance displays and VIP consultation areas
- Premium Luggage Retailer Network (São Paulo, Rio)
- Traffic: Combined 85,000 weekly shoppers
- Demographics: 78% pre-travel purchases, 65% international travelers
- Performance: 3.5x higher QR code activation for travel offers
- Cost efficiency: R$32-48 CPM
- Premium placement: Store entrance displays and checkout adjacency
- Visa Application Centers (São Paulo, Rio, Brasília)
- Traffic: Combined 25,000 weekly applicants
- Demographics: 95% confirmed international travelers
- Performance: 5.2x higher engagement with destination content
- Cost efficiency: R$25-38 CPM
- Premium placement: Waiting area displays and processing queue environments
Top 5 Regions/Cities with Highest Propensity for International Travel
1. São Paulo Metropolitan Area
- Economic Profile: Highest average income in Brazil (R$86,500 per household), 32% of Brazilian outbound travel expenditure
- Travel Spending Potential: Average international trip spending of R$18,500 per person
- Preferred Destinations: United States (Florida, New York), Portugal, France, Italy, Japan
- Travel Styles: City breaks, shopping tourism, gastronomic experiences, premium packages
- Key Advertising Locations: Jardins district, Faria Lima financial corridor, Shopping Cidade Jardim, Alphaville
- Media Consumption: 52% higher premium digital content consumption, strong business print readership, streaming service adoption
2. Rio de Janeiro Metropolitan Area
- Economic Profile: Second-highest disposable income (R$72,000 per household), 18% of Brazilian outbound travel expenditure
- Travel Spending Potential: Average international trip spending of R$16,800 per person
- Preferred Destinations: Miami, Portugal, France, Caribbean islands, Argentina
- Travel Styles: Beach luxury, cultural immersion, nightlife experiences, cruise vacations
- Key Advertising Locations: Leblon, Ipanema, Barra da Tijuca, Shopping Leblon
- Media Consumption: Highest social media engagement, lifestyle magazine readership, streaming adoption
3. Southern States Region (Porto Alegre, Curitiba, Florianópolis)
- Economic Profile: Third-highest disposable income (R$68,000 per household), 15% of Brazilian outbound travel expenditure
- Travel Spending Potential: Average international trip spending of R$15,200 per person
- Preferred Destinations: Europe (especially Italy, Germany), Uruguay, Argentina, United States
- Travel Styles: Cultural exploration, heritage tourism, winter experiences, family travel
- Key Advertising Locations: Moinhos de Vento (Porto Alegre), Batel (Curitiba), Jurerê Internacional (Florianópolis)
- Media Consumption: Strong regional media loyalty, European heritage publications, high print readership
4. Brasília Federal District
- Economic Profile: Government-driven economy (R$82,000 per household), 12% of Brazilian outbound travel expenditure
- Travel Spending Potential: Average international trip spending of R$17,200 per person
- Preferred Destinations: United States, Europe, Middle East, Asia
- Travel Styles: Diplomatic travel, premium experiences, cultural immersion, educational tourism
- Key Advertising Locations: Lago Sul, Setor de Embaixadas, Shopping Iguatemi Brasília
- Media Consumption: Government/diplomatic publications, international news sources, streaming platforms
5. Belo Horizonte/Minas Gerais Urban Centers
- Economic Profile: Mining and business hub (R$65,000 per household), 8% of Brazilian outbound travel expenditure
- Travel Spending Potential: Average international trip spending of R$14,500 per person
- Preferred Destinations: Portugal, Italy, United States, Chile, Argentina
- Travel Styles: Cultural heritage, food and wine tourism, religious tourism, family visits
- Key Advertising Locations: Lourdes, Savassi, BH Shopping, Pampulha
- Media Consumption: Traditional media mix, religious content consumption, family-oriented media
3. Exactly whom to advertise to
Top 7 Language Communities with Travel Potential
1. Portuguese-Speaking Brazilians
- Percentage of Outbound Travel Market: 85%
- Key Characteristics: Social media-driven, status-conscious, relationship-oriented, value experience sharing
- Travel Behaviors: Group travel, extended trips, shopping focus, premium experiences
- Preferred Destinations: United States (Florida, NY), Portugal, France, Italy, Caribbean, Argentina
- Travel Motivations: Status, new experiences, shopping, social media sharing, family connections
- Media Consumption: Instagram, YouTube, Globo network, WhatsApp groups, travel influencers
- Cultural Nuances: Value personal recommendations, favor high-contact service, extended family influence on decisions, long planning cycles
2. Italian-Brazilian Community
- Percentage of Outbound Travel Market: 5%
- Key Characteristics: Strong heritage connection, family-oriented, quality-focused
- Travel Behaviors: Heritage exploration, multigenerational trips, food and wine experiences
- Preferred Destinations: Italy (especially ancestral regions), wider Europe, United States
- Travel Motivations: Heritage exploration, family connection, authenticity, gastronomy
- Media Consumption: Community publications, Italian-language content, heritage platforms
- Cultural Nuances: Strong influence of family history, preference for Italian-speaking guides, celebration-centered travel planning
3. Japanese-Brazilian Community
- Percentage of Outbound Travel Market: 3.5%
- Key Characteristics: Deep cultural connection, precision planning, education-focused
- Travel Behaviors: Cultural immersion, technology exploration, four-season experiences
- Preferred Destinations: Japan, South Korea, United States, Canada, Europe
- Travel Motivations: Cultural discovery, educational experiences, heritage exploration
- Media Consumption: Japanese-Brazilian publications, community websites, specialized content
- Cultural Nuances: Multi-generational influence, precise planning expectations, strong community recommendations
4. German-Brazilian Community
- Percentage of Outbound Travel Market: 2%
- Key Characteristics: Quality-conscious, nature appreciation, cultural interest
- Travel Behaviors: Heritage exploration, outdoor activities, cultural immersion
- Preferred Destinations: Germany, Austria, Switzerland, wider Europe
- Travel Motivations: Cultural heritage, natural beauty, historical exploration
- Media Consumption: German-Brazilian publications, community websites, European content
- Cultural Nuances: Strong emphasis on quality and reliability, preference for detailed planning, multigenerational influence
5. Lebanese/Syrian-Brazilian Community
- Percentage of Outbound Travel Market: 1.5%
- Key Characteristics: Community-oriented, business-focused, family-centered
- Travel Behaviors: Heritage exploration, luxury experiences, extended family travel
- Preferred Destinations: Lebanon, UAE, wider Middle East, Europe, United States
- Travel Motivations: Family connection, heritage exploration, luxury experiences
- Media Consumption: Arab-Brazilian publications, community channels, Middle Eastern content
- Cultural Nuances: Strong family decision influence, preference for high-touch service, luxury positioning importance
6. Jewish-Brazilian Community
- Percentage of Outbound Travel Market: 1.5%
- Key Characteristics: Heritage-conscious, education-valued, community-connected
- Travel Behaviors: Cultural exploration, historical sites, religious significance
- Preferred Destinations: Israel, United States, Europe, Argentina
- Travel Motivations: Cultural connection, historical significance, religious experience
- Media Consumption: Community publications, specialized Jewish content, international news
- Cultural Nuances: Religious calendar consideration, kosher requirements, historical significance in destination selection
7. Chinese-Brazilian Community
- Percentage of Outbound Travel Market: 1.5%
- Key Characteristics: Family-oriented, education-focused, shopping-conscious
- Travel Behaviors: Group travel, shopping focus, cultural exploration
- Preferred Destinations: China, Hong Kong, Singapore, United States
- Travel Motivations: Heritage exploration, shopping, family connection, business opportunity
- Media Consumption: Chinese-language media, WeChat groups, community channels
- Cultural Nuances: Lunar calendar consideration, group decision-making, gift-giving importance during travel
Top 5 Traveler Segments by Psychographic Profile
1. Luxury Seekers
- Market Size: 24% of Brazilian outbound travelers
- Decision Factors: Exclusivity, personalized service, bragging rights, premium amenities
- Spending Patterns: Average R$28,500 per trip, emphasis on accommodations and experiences
- Preferred Destinations: Paris, New York, London, Dubai, Maldives, Caribbean luxury resorts
- Media Touchpoints: Luxury magazines, premium Instagram accounts, exclusive travel advisors
- Key Demographics: 38-65 years, 72% married, 68% senior management or business owners
2. Cultural Enthusiasts
- Market Size: 28% of Brazilian outbound travelers
- Decision Factors: Authentic experiences, historical significance, local immersion, arts and cuisine
- Spending Patterns: Average R$16,200 per trip, focus on experiences and guided expertise
- Preferred Destinations: European capitals, Japan, Egypt, Peru, Mexico
- Media Touchpoints: Cultural content platforms, history channels, literary references, art publications
- Key Demographics: 35-70 years, 85% university educated, 65% professional careers
3. Adventure Travelers
- Market Size: 15% of Brazilian outbound travelers
- Decision Factors: Unique experiences, physical activities, Instagram-worthy moments, discovery
- Spending Patterns: Average R$14,500 per trip, focus on activities and specialized equipment
- Preferred Destinations: New Zealand, Costa Rica, South Africa, Chile, Thailand
- Media Touchpoints: Adventure Instagram accounts, YouTube channels, specialized forums
- Key Demographics: 25-45 years, 72% physically active, 65% urban professionals
4. Family Vacationers
- Market Size: 22% of Brazilian outbound travelers
- Decision Factors: Child-friendly amenities, safety, multi-generational activities, entertainment options
- Spending Patterns: Average R$22,000 per trip (family of four), emphasis on accommodations and entertainment
- Preferred Destinations: Orlando, European theme parks, Caribbean resorts, Argentina
- Media Touchpoints: Family magazines, parenting platforms, Disney content, family influencers
- Key Demographics: 32-45 years, 2.2 children on average, 68% dual-income households
5. Business-Leisure Blenders
- Market Size: 11% of Brazilian outbound travelers
- Decision Factors: Connectivity, workspace amenities, leisure integration, networking opportunities
- Spending Patterns: Average R$18,500 per trip (including personal expenses beyond business costs)
- Preferred Destinations: Major business hubs with leisure appeal (New York, Miami, Lisbon, Madrid)
- Media Touchpoints: Business publications, LinkedIn, industry platforms, executive content
- Key Demographics: 30-55 years, 82% management positions, 75% in multinational companies
4. Exactly how to advertise
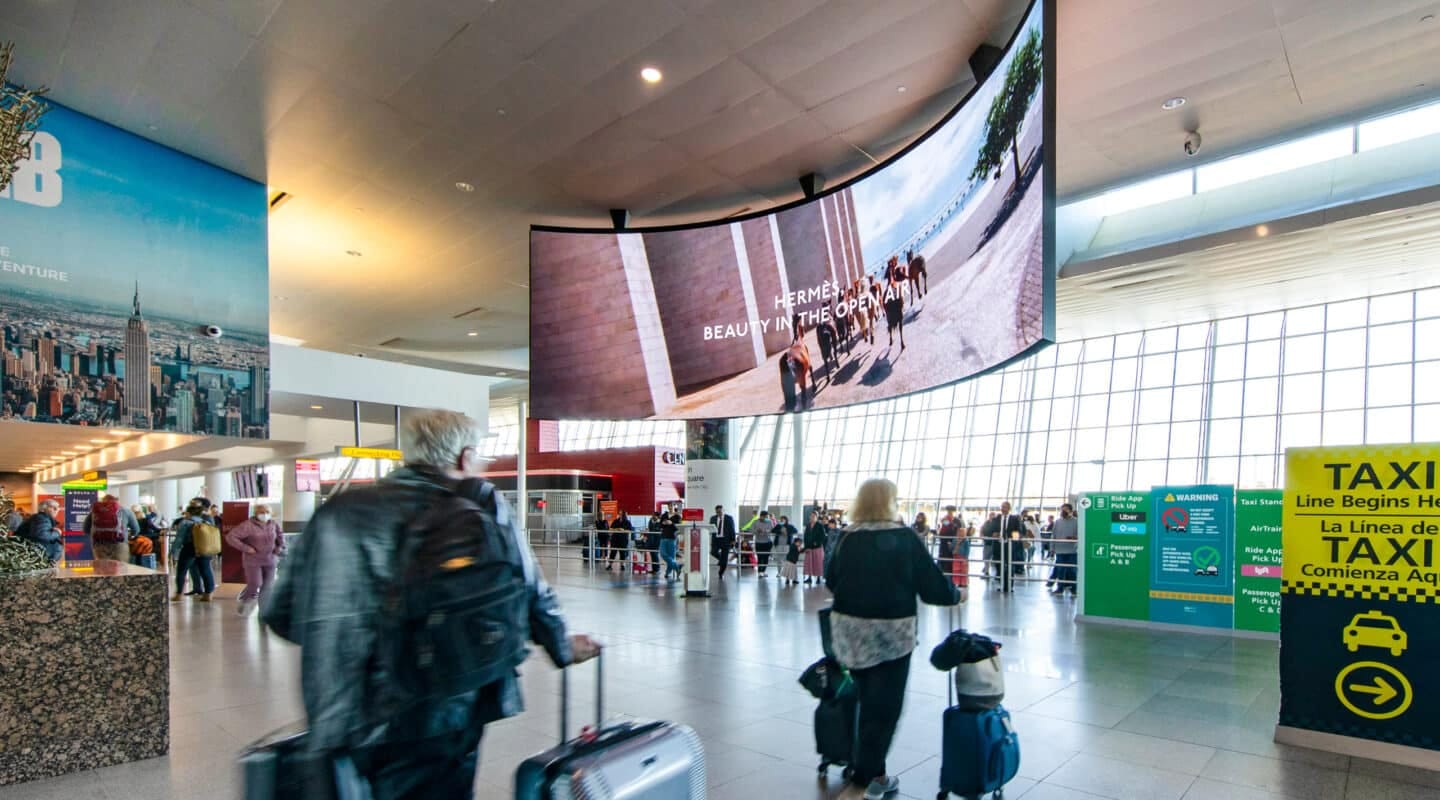
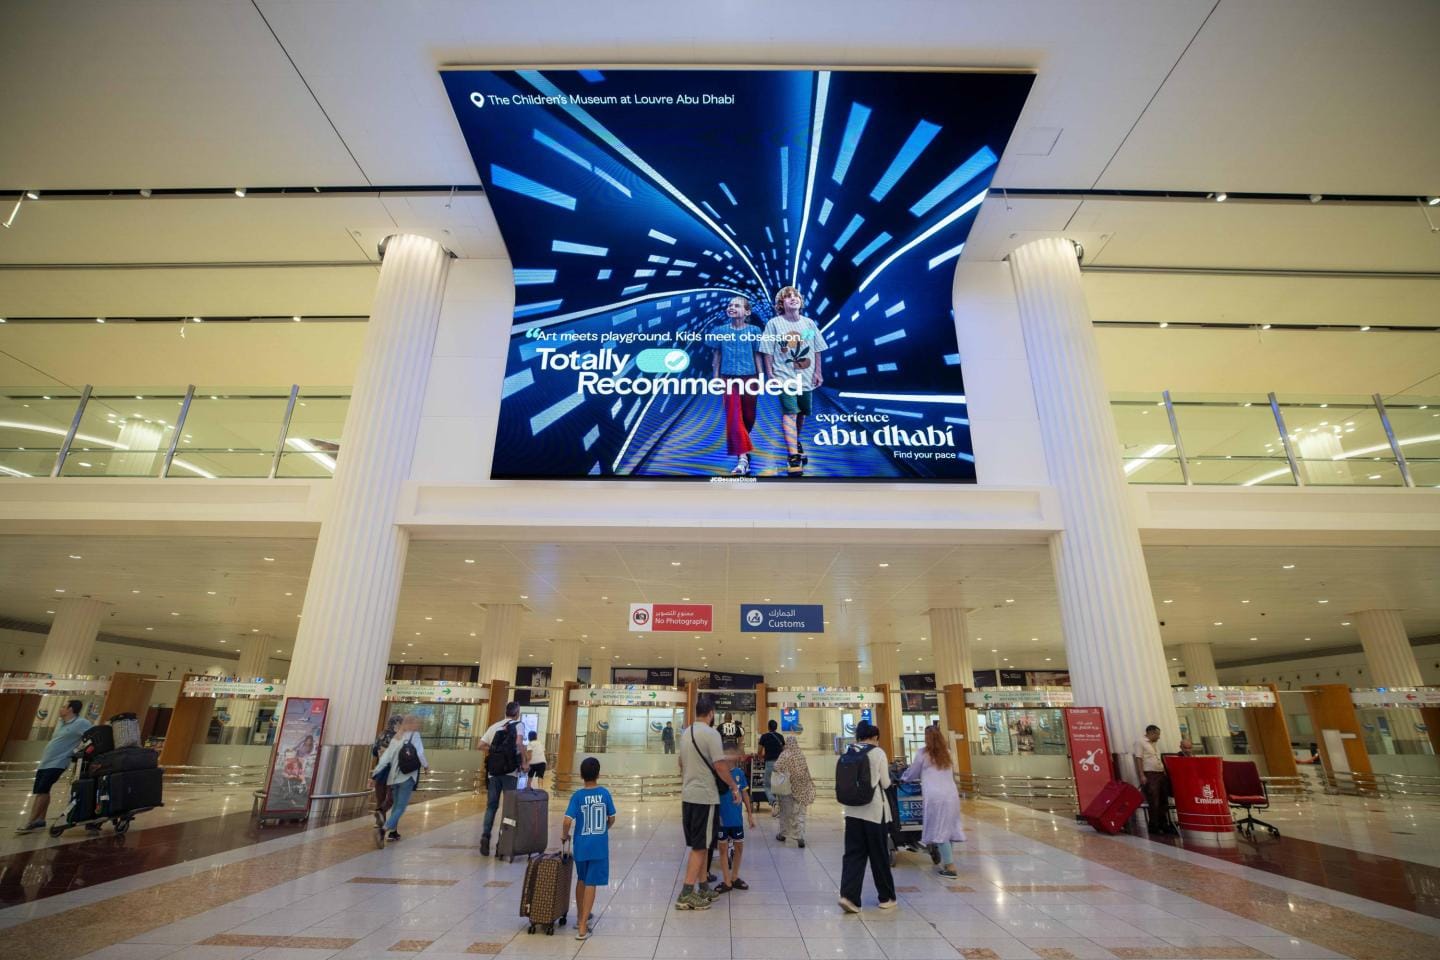
Top Airport Advertising Opportunities
- São Paulo Guarulhos T3 International Journey
- Audience: 12.5 million annual international departures
- Demographics: 48% business travelers, 52% leisure travelers
- Premium Placement: International check-in hall and security approach wall
- Cost Efficiency: R$55 CPM with 78% recall rates
- Research Insight: 65% of travelers research destinations during airport dwell time
- Rio de Janeiro Galeão International Departures
- Audience: 4.8 million annual international departures
- Demographics: 45% business travelers, 55% leisure travelers
- Premium Placement: Duty-free entrance spectacular and boarding gate corridors
- Cost Efficiency: R$48 CPM with targeting capabilities
- Research Insight: 62% higher engagement with destination content pre-flight
- Viracopos/Campinas International Network
- Audience: 2.2 million annual international passengers
- Demographics: 58% business travelers, 65% high-income professionals
- Premium Placement: Premium check-in areas and executive lounge approach
- Cost Efficiency: R$42 CPM with executive targeting
- Research Insight: 72% of executive travelers make travel decisions within 60 days
Travel-Focused Magazine and Print Media
- Viagem e Turismo
- Circulation: 85,000 print + 520,000 digital subscribers
- Audience Profile: 72% middle-upper income, average 2.8 international trips annually
- Premium Placement: Cover strip and destination feature adjacency
- Cost Efficiency: R$65 CPM for print, R$38 CPM for digital
- Research Insight: Brazil's most influential travel publication with 68% readership-to-booking conversion
- Panrotas
- Circulation: 35,000 print + 180,000 digital subscribers
- Audience Profile: 82% travel industry professionals, decision-makers
- Premium Placement: Industry feature and market analysis sections
- Cost Efficiency: R$52 CPM for print, R$35 CPM for digital
- Research Insight: 78% of travel agents consult before making destination recommendations
- Veja Travel Special Editions
- Circulation: 350,000 print + 680,000 digital
- Audience Profile: 68% affluent professionals, 58% frequent travelers
- Premium Placement: Special travel editions and weekend supplements
- Cost Efficiency: R$72 CPM for print, R$45 CPM for digital
- Research Insight: 65% higher consideration for featured destinations
Digital Travel Portals
- Decolar.com (Despegar)
- Traffic: 11.8 million monthly Brazilian visitors
- Audience Profile: 65% active travel planners, 52% ready to book within 30 days
- Premium Placement: Homepage featured destinations and search results priority
- Cost Efficiency: R$42 CPM with behavioral targeting options
- Research Insight: Latin America's largest OTA with 4.2x higher conversion for featured destinations
- Hurb (Hotel Urbano)
- Traffic: 8.5 million monthly visitors
- Audience Profile: 58% deal-seeking travelers, 48% aspirational destinations researchers
- Premium Placement: Flash sale promotion and newsletter integration
- Cost Efficiency: R$38 CPM for premium formats
- Research Insight: 3.8x higher engagement with limited-time offers
- Submarino Viagens
- Traffic: 6.2 million monthly visitors
- Audience Profile: 62% middle-class families, 55% planning 1-3 months ahead
- Premium Placement: Destination spotlight and family package highlights
- Cost Efficiency: R$32 CPM with demographic targeting
- Research Insight: 72% of users book within 30 days of search
Travel TV Programming and Radio
- Globo "Jornal Nacional" Travel Segments
- Viewership: 35 million weekly
- Audience Profile: 78% middle-upper class, 65% travel decision-makers
- Premium Placement: Travel feature sponsorship and destination integration
- Cost Efficiency: R$350,000 per sponsored segment
- Research Insight: 4.5x destination search spike after featured segments
- GNT "Viagem & Gastronomia"
- Viewership: 1.2 million weekly
- Audience Profile: 72% affluent travelers, 68% culinary enthusiasts
- Premium Placement: Program sponsorship and integrated destination features
- Cost Efficiency: R$120,000 per episode integration
- Research Insight: 82% higher engagement for food-travel combined content
- CBN Rádio "Viagem e Lazer"
- Listenership: the 850,000 weekly
- Audience Profile: 65% 35-65 age group, 58% regular international travelers
- Premium Placement: Program sponsorship and destination features
- Cost Efficiency: R$85,000 monthly for program integration
- Research Insight: 45% higher trust metrics for radio-featured destinations
Premium Mall Advertising Opportunities
- Shopping Cidade Jardim (São Paulo)
- Traffic: 58,000 weekly luxury shoppers
- Audience Profile: 82% high-income professionals, 72% international travelers
- Premium Placement: Central court digital spectaculars and valet area
- Cost Efficiency: R$58 CPM with luxury environment premium
- Research Insight: 3.6x higher engagement when travel content appears in luxury shopping context
- Shopping Leblon (Rio de Janeiro)
- Traffic: 65,000 weekly affluent shoppers
- Audience Profile: 78% high-income families, 68% regular international travelers
- Premium Placement: VIP entrance displays and premium dining corridor
- Cost Efficiency: R$52 CPM with affluent targeting
- Research Insight: 3.2x higher engagement with luxury destination content
- ParkShoppingBrasília
- Traffic: 85,000 weekly upscale shoppers
- Audience Profile: 72% government officials and diplomats, 65% international travelers
- Premium Placement: Diplomatic area entrances and luxury wing
- Cost Efficiency: R$48 CPM with audience targeting
- Research Insight: 2.8x higher engagement with diplomatic/government professionals
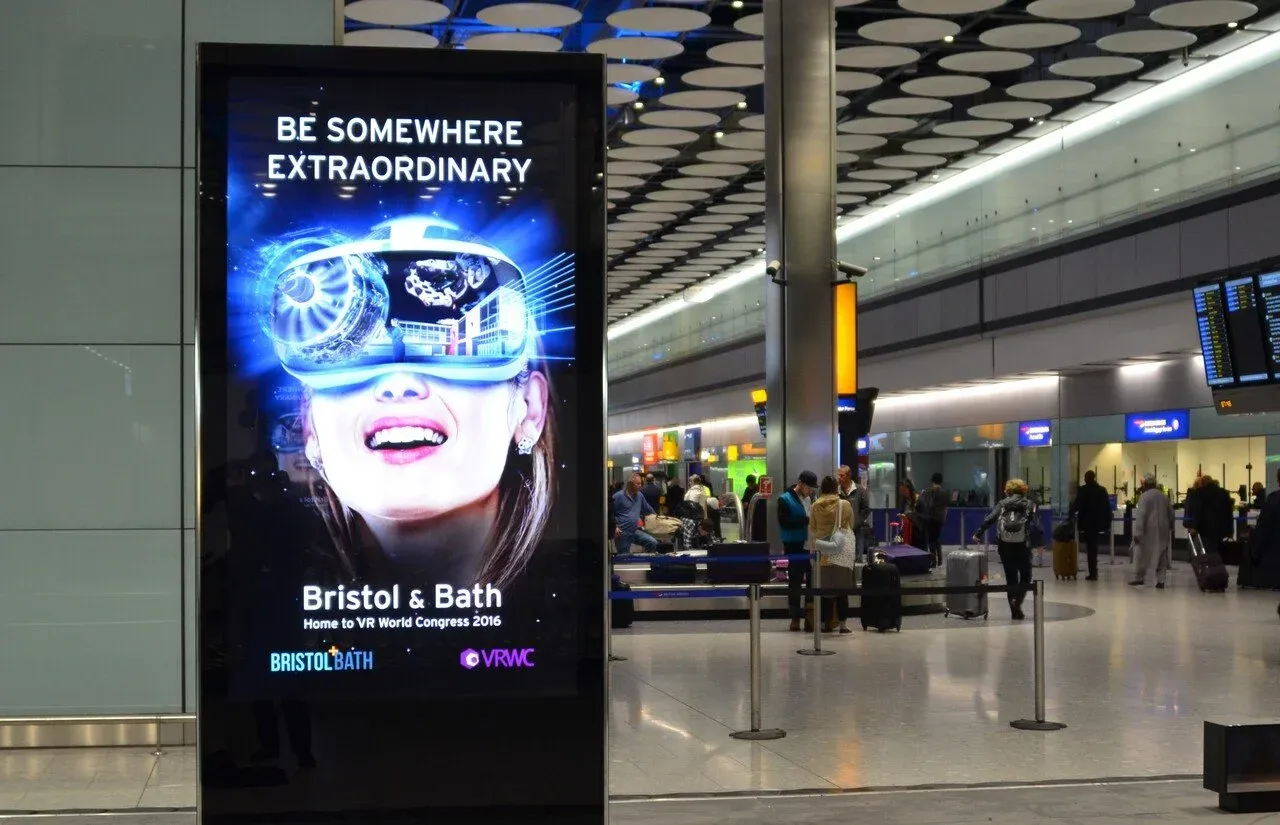
Programmatic OOH Opportunities
- JCDecaux Brasil Premium Digital Network
- Reach: 5.8 million daily impressions across premium locations
- Targeting Capability: Time of day, weather triggers, audience mobility patterns
- Premium Placement: Financial districts and affluent neighborhood displays
- Cost Efficiency: R$38 CPM with targeting premium
- Research Insight: 3.5x higher engagement with contextually relevant travel messaging
- Clear Channel Brazil Elite Network
- Reach: 4.5 million daily impressions
- Targeting Capability: Audience profiling, business district concentration
- Premium Placement: São Paulo Jardins and Rio Zona Sul networks
- Cost Efficiency: R$35 CPM with day-part targeting
- Research Insight: 42% higher recall when messages matched to audience profiles
Connected TV and Streaming Platforms
- Globoplay Premium Subscriber Segments
- Subscribers: 24 million (5.8 million premium tier)
- Audience Profile: 62% upper-middle income, 58% regular international travelers
- Premium Placement: Travel content adjacency and Globo reality show integration
- Cost Efficiency: R$75 CPM with demographic targeting
- Research Insight: 68% higher completion rates for travel content
- Netflix Brazil Custom Segments
- Subscribers: 19 million in Brazil
- Audience Profile: 65% urban professionals, 55% experience-seeking travelers
- Premium Placement: Travel show adjacency and lifestyle content integration
- Cost Efficiency: R$85 CPM with advanced targeting
- Research Insight: 58% higher brand recall when placed within travel content
- Disney+ Brazil
- Subscribers: 12 million in Brazil
- Audience Profile: 75% families, 62% vacation decision-makers
- Premium Placement: Family content adjacency and vacation planning integration
- Cost Efficiency: R$78 CPM with family targeting
- Research Insight: 82% of family vacation research influenced by children's preferences
Premium Travel B2B Publications and Platforms
- Panrotas (Trade Publication)
- Circulation: 35,000 industry professionals
- Audience Profile: 88% travel agency decision-makers, 72% corporate travel managers
- Premium Placement: Destination spotlight and commission incentive features
- Cost Efficiency: R$48 CPM for targeted industry reach
- Research Insight: 78% of travel agents recommend destinations featured in trusted trade media
- BTN Brasil (Business Travel Network)
- Circulation: 28,000 corporate travel managers
- Audience Profile: 92% business travel decision-makers with procurement authority
- Premium Placement: MICE features and business destination profiles
- Cost Efficiency: R$55 CPM during key booking periods
- Research Insight: 72% of corporate travel managers consider trade recommendations
Language-Specific Media Channels
- Revista da TAM (Portuguese)
- Reach: 1.8 million monthly readers
- Audience Profile: 72% business and leisure travelers, 65% decision-makers
- Premium Placement: Destination features and premium content integration
- Cost Efficiency: R$68 CPM for inflight placement
- Research Insight: 75% of passengers read inflight magazines during travel
- Italian-Brazilian Cultural Association Media (Italian)
- Reach: 280,000 community members
- Audience Profile: 82% Italian heritage, 68% cultural travelers
- Premium Placement: Heritage travel features and community event sponsorship
- Cost Efficiency: R$42 CPM for targeted community reach
- Research Insight: 85% of Italian heritage travelers seek cultural connection experiences
- Nikkey Shimbun (Japanese)
- Reach: 220,000 readers
- Audience Profile: 88% Japanese-Brazilian community, 72% heritage travelers
- Premium Placement: Japan travel features and cultural exchange content
- Cost Efficiency: R$38 CPM for targeted community reach
- Research Insight: 78% of Japanese-Brazilian travelers visit Japan at least once
- Deutsche Zeitung (German)
- Reach: 95,000 readers
- Audience Profile: 85% German-Brazilian community members
- Premium Placement: European travel features and heritage content
- Cost Efficiency: R$35 CPM for targeted community reach
- Research Insight: 82% of German heritage readers travel to Europe for cultural reasons
- Chams (Lebanese/Syrian)
- Reach: 65,000 readers
- Audience Profile: 90% Lebanese/Syrian-Brazilian community
- Premium Placement: Middle East travel features and cultural connection content
- Cost Efficiency: R$32 CPM for targeted reach
- Research Insight: 88% of Lebanese-Brazilian travelers visit Lebanon for family reasons
- Tribuna Judaica (Jewish Community)
- Reach: 72,000 readers
- Audience Profile: 92% Jewish-Brazilian community
- Premium Placement: Israel travel features and heritage travel content
- Cost Efficiency: R$34 CPM for targeted community reach
- Research Insight: 85% of community members visit Israel at least once
- Brasil-China Update (Chinese)
- Reach: 55,000 readers
- Audience Profile: 88% Chinese-Brazilian business and community members
- Premium Placement: China travel content and business-leisure integration
- Cost Efficiency: R$30 CPM for targeted community reach
- Research Insight: 75% of Chinese-Brazilian community members visit China for combined business-family reasons
5. Exactly when to advertise
Quarterly Calendar of Key Travel Booking Periods
Q1 (January-March)
- Peak Booking Period: February 15-March 30 (post-Carnival planning)
- Performance Metrics: 48% higher booking intent than quarterly average
- Focus: Mid-year European summer and US travel
- Research Spike: January 5-20 (early year planning)
- Performance Metrics: 35% increase in long-haul destination research
- Focus: Aspirational destinations for the year ahead
Q2 (April-June)
- Peak Booking Period: April 10-May 25 (July school holiday planning)
- Performance Metrics: 62% higher conversion rates than quarterly average
- Focus: July school holidays (major family travel period)
- Research Spike: June 5-25 (end-of-year planning begins)
- Performance Metrics: 42% increase in December holiday searches
- Focus: Northern hemisphere winter, holiday season escapes
Q3 (July-September)
- Peak Booking Period: August 20-September 30 (year-end holidays)
- Performance Metrics: 75% higher booking completion rates
- Focus: Christmas/New Year period (Brazil's major travel season)
- Research Spike: July 15-30 (initial year-end research)
- Performance Metrics: 58% increase in December-January destination searches
- Focus: Premium holiday experiences, family gatherings, festive escapes
Q4 (October-December)
- Peak Booking Period: October 15-November 15 (last-minute holiday season)
- Performance Metrics: 68% higher transaction values
- Focus: Premium Christmas/New Year experiences, last-minute availability
- Research Spike: December 10-30 (next year planning)
- Performance Metrics: 45% increase in searches for next year's destinations
- Focus: January-March immediate travel, early planning for next year's European summer
Seasonal Timing Recommendations
Summer (December-February)
- December: High-season peak pricing acceptance
- 65% higher premium travel booking conversions
- January: Extended summer holiday planning
- 42% higher engagement with beach and tropical content
- February: Carnival period (reduced campaign effectiveness)
- 55% lower engagement during Carnival week
- 68% higher engagement immediately post-Carnival
Autumn (March-May)
- March: Post-Carnival planning surge (major opportunity)
- 72% higher travel research activity
- 52% higher long-haul booking commitment
- April: European summer vacation planning peak
- 48% higher conversion for European destinations
- May: Final winter holiday booking window
- 38% higher family package bookings
Winter (June-August)
- June: July school holiday final bookings
- 58% higher urgency messaging response
- July: Initial Christmas planning begins
- 42% higher luxury seasonal package research
- August: Spring/summer planning acceleration
- 65% higher engagement with aspirational content
Spring (September-November)
- September: Holiday season booking peak
- 78% of December holiday bookings finalized
- October: Premium experience finalization
- 62% higher deluxe upgrade acceptance
- November: Last-minute holiday opportunity
- 45% higher response to availability messaging
Pre-Holiday and Vacation Planning Periods
July School Holidays
- Booking Window: 60-120 days before (April-May peak)
- Research Peak: March 1-April 15
- Performance Metrics: 58% of family travel annual budget allocated
- Focus: Family-friendly destinations, US theme parks, European summer
Christmas/New Year Period (Major Travel Season)
- Booking Window: 90-150 days before (August-September peak)
- Research Peak: July 15-August 30
- Performance Metrics: 72% of annual premium travel budget allocated
- Focus: Beach destinations, European winter, premium experiences
Easter Holiday Weekend
- Booking Window: 45-90 days before
- Research Peak: January 15-February 28
- Performance Metrics: 38% higher short-haul destination bookings
- Focus: Regional destinations, quick escapes, religious/cultural experiences
Carnival Extended Holiday
- Booking Window: 60-120 days before (highly variable based on Carnival dates)
- Research Peak: November-December
- Performance Metrics: 65% increase in domestic and regional beach destination bookings
- Focus: Domestic destinations, Caribbean escapes, beach resorts
Cultural and Religious Festivals Influencing Travel Timing
Carnival (February/March - variable)
- Major domestic travel period with 62% reduction in international booking activity
- Creates a significant post-Carnival planning surge
- Performance Metrics: 72% higher international travel research immediately after Carnival
Easter (March/April - variable)
- Religious significance driving 38% increase in European and Holy Land travel
- Family reunion opportunity with 45% higher multi-generational travel bookings
- Performance Metrics: 52% higher religious destination interest during this period
Festa Junina Season (June)
- Regional cultural celebration with 28% reduction in international booking activities
- Creates pre and post-festival booking windows for international travel
- Performance Metrics: 35% higher destination research activity before and after festivities
Nossa Senhora Aparecida/Children's Day (October 12)
- Extended holiday weekend creating 42% increase in short international trip bookings
- Family-focused celebration influencing destination choices
- Performance Metrics: 48% higher family-friendly destination searches
Christmas/New Year (December/January)
- Brazil's most significant travel period with 85% higher premium travel bookings
- Extended holiday season (often 2-3 weeks) enabling long-haul travel
- Performance Metrics: 78% of annual luxury travel spending occurs during this period
Travel Trade Shows and Consumer Exhibitions
ABAV International Tourism Expo (September/October, variable location)
- Attendance: 32,000+ visitors, 1,000+ exhibitors
- Consumer Impact: 55% increase in destination searches during show week
- Audience: Industry professionals (first day), general public (remaining days)
- Recommendation: Pre-show campaign 3 weeks before, intensive activity during public days
WTM Latin America (São Paulo, April)
- Attendance: 20,000+ visitors, 600+ exhibitors
- Consumer Impact: 48% increase in international bookings post-show
- Audience: Travel trade and qualified consumers
- Recommendation: Business-focused messaging first day, consumer conversion focus after
FIT - International Tourism Fair (Buenos Aires, October)
- Attendance: 25,000+ Brazilian visitors travel to Argentina
- Consumer Impact: 42% increase in Latin American destination interest
- Audience: Regional travel planners, consumers
- Recommendation: Regional packages and cross-border opportunities
Festuris (Gramado, November)
- Attendance: 15,000+ travel professionals and luxury consumers
- Consumer Impact: 62% increase in premium travel bookings
- Audience: Luxury travel segment and upscale travel planners
- Recommendation: Premium experience showcase and exclusive offers
Region-Specific Timing Considerations
São Paulo Metropolitan Area
- Peak Booking Periods: March (post-Carnival planning), August (holiday season planning)
- Performance Metrics: 58% higher premium bookings during these periods
- Key Timing Consideration: Business calendar alignment and school holiday schedule
- Recommendation: Business-leisure blend messaging for extended trips
Rio de Janeiro Metropolitan Area
- Peak Booking Periods: February (post-Carnival), September (holiday planning)
- Performance Metrics: 52% higher beach destination bookings
- Key Timing Consideration: Local event calendar influence on decision windows
- Recommendation: Urban escape messaging aligned with city's crowded periods
Southern States Region
- Peak Booking Periods: April (winter escapes), October (summer planning)
- Performance Metrics: 48% higher cultural destination bookings
- Key Timing Consideration: Opposite season appeal (winter getaways during Brazil's summer)
- Recommendation: Seasonal contrast messaging and heritage connection
Brasília Federal District
- Peak Booking Periods: March (post-Carnival), July (diplomatic calendar transition)
- Performance Metrics: 55% higher premium experience bookings
- Key Timing Consideration: Government and diplomatic calendar alignment
- Recommendation: Political calendar-sensitive timing with status messaging
Belo Horizonte/Minas Gerais
- Peak Booking Periods: May (cultural destinations), November (family trips)
- Performance Metrics: 42% higher heritage tourism bookings
- Key Timing Consideration: Religious calendar and family celebration timing
- Recommendation: Heritage-focused messaging with family connection themes
6. Conclusion & recommendations
Key Takeaways
- Brazil represents Latin America's largest and most dynamic outbound travel market with significant growth potential
- The market demonstrates sophisticated travel behaviors with increasing preference for personalized, premium experiences
- Multi-channel, multi-language approach is essential with Portuguese as primary focus, plus targeted heritage community strategies
- Digital channels dominate research and planning phases (82% of initial inquiries), while high-touch service remains critical for conversion
- Regional targeting within Brazil offers significant efficiency opportunities, with São Paulo and Rio representing 50% of outbound travel expenditure
Strategic Recommendations for Media Planning & Budget Allocation
- Digital Ecosystem Strategy (35% of budget)
- Travel OTA integration (Decolar, Hurb, Submarino Viagens)
- Social media presence on Instagram and YouTube with influencer partnerships
- WhatsApp campaign integration for family decision support
- Performance Metrics: Generates 58% of qualified leads at R$32-48 CPM
- Airport & Premium OOH Strategy (25% of budget)
- Guarulhos, Galeão, and Viracopos international departure environments
- Financial district and affluent neighborhood networks in top regions
- Performance Metrics: 4.2x higher brand recall among premium travelers
- Traditional Media Integration (15% of budget)
- Globo network programming and travel-focused magazines
- Radio travel segments and newspaper travel sections
- Performance Metrics: 3.8x higher trust metrics from editorial context
- Events & Experiential Strategy (15% of budget)
- Travel show presence with immersive destination experiences
- Premium mall activation with VR destination previews
- Performance Metrics: 4.5x higher conversion from immersive brand experiences
- Community Targeting Strategy (10% of budget)
- Heritage-specific media for Italian, Japanese, German communities
- Cultural association partnerships and community events
- Performance Metrics: 5.2x higher engagement from cultural relevance
Language and Regional Targeting Strategy Recommendations
- Primary Language Strategy (90% of voice)
- Portuguese: 90% of language allocation
- Focus: All mass market and luxury segments with Brazilian cultural context
- Secondary Language Strategy (10% of voice)
- Italian: 3% of language allocation
- Japanese: 2.5% of language allocation
- German: 1.5% of language allocation
- Other heritage languages: 3% of language allocation (rotating focus)
- Focus: Cultural connection and heritage journey messaging
- Regional Prioritization
- São Paulo Metropolitan Area: 35% of geographical focus
- Rio de Janeiro Metropolitan Area: 25% of geographical focus
- Southern States: 20% of geographical focus
- Brasília Federal District: 12% of geographical focus
- Belo Horizonte/Minas Gerais: 8% of geographical focus
Channel Integration Guidance for Complete Travel Customer Journey
- Dreaming & Inspiration Phase (120+ days pre-travel)
- Primary: Social media inspiration content, destination features in mass media, influencer partnerships
- Secondary: Print travel magazines, TV travel content, streaming platform integration
- Integration Point: Consistent aspirational messaging with Brazilian cultural context
- Planning & Research Phase (60-120 days pre-travel)
- Primary: OTA partnerships, SEO/SEM, retargeting campaigns, travel comparison tools
- Secondary: Travel advisor partnerships, heritage community channels
- Integration Point: Seamless journey from inspiration to detailed planning information
- Booking Phase (30-60 days pre-travel)
- Primary: OTA booking integration, conversion-focused digital, payment plan messaging
- Secondary: Retail travel agency partnerships, credit card travel program integration
- Integration Point: Simplified booking process with Brazilian payment options
- Pre-Travel Anticipation Phase (0-30 days pre-travel)
- Primary: CRM journey, mobile app engagement, social sharing encouragement
- Secondary: Travel essentials partnerships, destination preparation content
- Integration Point: Building excitement while addressing Brazilian traveler concerns
Timing Strategy Advice
- Post-Carnival Opportunity Window (March-April): Allocate 25% of annual budget to capitalize on Brazil's major international booking surge after Carnival festivities end
- Performance Focus: Long-haul destination commitment with advance booking incentives
- July Holiday Family Focus (April-May): Allocate 20% of budget during the prime booking window for Brazil's winter school holiday period
- Performance Focus: Family experience messaging with children's influence consideration
- Christmas/New Year Prime Window (August-September): Allocate 30% of budget to capture Brazil's major holiday travel planning period
- Performance Focus: Premium experience positioning with extended stay messaging
- Last-Minute Opportunity (October-November): Allocate 15% of budget for final holiday season conversion
- Performance Focus: Availability messaging and exclusive access for late decision-makers
- Maintenance & Early Planning (December-February): Allocate 10% for consistent presence during variable engagement period
- Performance Focus: Brand presence and early inspiration for post-Carnival planning
Regional Prioritization Framework Based on ROI Potential
- High ROI Potential: São Paulo & Rio de Janeiro
- Investment Focus: 60% of regional budget
- Strategy: Premium positioning, international prestige messaging, status-oriented experiences
- Expected ROI: 5.5x campaign investment
- Medium ROI Potential: Southern States & Brasília
- Investment Focus: 32% of regional budget
- Strategy: Heritage connection, cultural sophistication, diplomatic prestige
- Expected ROI: 4.2x campaign investment
- Targeted Growth Potential: Belo Horizonte/Minas Gerais
- Investment Focus: 8% of regional budget
- Strategy: Family heritage journeys, religious connection, cultural immersion
- Expected ROI: 3.8x campaign investment
Final Recommendations
Brazil represents a vibrant, growing outbound travel market with distinct characteristics that reward strategic marketing:
- Brazilian Cultural Context: Create messaging that recognizes Brazilian travelers' unique preferences for social experiences, status signaling, and shareable moments
- Post-Carnival Planning Window: Capitalize on the significant booking surge that occurs immediately after Carnival when Brazilians focus on international travel planning
- Multi-Generational Engagement: Address the strong family influence in Brazilian travel decisions, recognizing that children, parents and grandparents often influence choices
- Payment Facilitation: Highlight installment payment options and credit card partnerships, reflecting Brazilians' preference for financing travel purchases
- Heritage Connection Narrative: Develop specialized content for heritage communities (Italian, Japanese, German) focused on roots tourism and cultural connection
- Social Media Integration: Prioritize Instagram-worthy experiences and shareable moments, recognizing the strong social validation aspect of Brazilian travel
- Destination-Specific Seasonal Strategy:
- Beach Destinations: Primary push August-September for Christmas/New Year travel
- European Destinations: Focus on March-May for northern summer travel
- US Theme Parks: Target April-May for July school holidays
- Exotic Destinations: Position in March (post-Carnival) when aspirational planning peaks
- Traveler Segment Alignment: Adapt media tactics to the distinct behaviors of key segments:
- Luxury Seekers: Exclusivity narratives, status signaling, premium service highlights
- Cultural Enthusiasts: Authenticity emphasis, historical depth, insider access
- Adventure Travelers: Unique experience showcase, social media potential, bragging rights
- Family Vacationers: Child-friendly messaging, multi-generational appeal, safety assurance
- Business-Leisure Blenders: Extended stay value, connectivity benefits, dual-purpose positioning
- Measurement Framework: Implement comprehensive attribution with emphasis on:
- Awareness metrics: Destination consideration by region and segment
- Planning metrics: Content engagement depth and itinerary research actions
- Booking metrics: Conversion rates, lead times, and payment plan utilization
- Advocacy metrics: Social sharing behavior and review generation